
Resources
Predoc Tips
Sources for finding predoctoral and RA positions
This list is not exhaustive, but it’s a good place to start.
A hub of predoc resources. Predoc.org collects useful materials, including practice coding tasks and a newsletter with advertised positions.
Sites that aggregate many postings
- NBER posts non-NBER RA positions here, and advertises some directly here.
- Professors and others tag relevant RA postings on the @econ_RA Twitter/X page (no account needed to read).
Organized predoc programs with a set hiring cycle
- Stanford: SIEPR predoctoral research fellows program
- Chicago: EPIC (Energy Policy Institute)
- Harvard: EPoD Research Fellow postings here
- Harvard: Opportunity Insights (two-year commitment) here
- Yale: predoctoral fellows program
- Princeton: a cross-department university program
Programs for US citizens and/or permanent residents only
- Harvard Research Scholar Initiative (no visa sponsorship)
- PhD Excellence Initiative (NYU Stern)
Other sources to check
- J-PAL Careers (note: some J-PAL roles do not sponsor visas, but other postings do)
- Innovations for Poverty Action (IPA)
- Brown and Princeton often post in their own career portals, e.g. Predoctoral Research Jobs at Princeton
- The World Bank; look for Research Assistant and ET Consultant roles
Guides
- J-PAL’s 2-page guide on landing an RA position
- My archived predoc search guide (PDF, Nov 2020)
AI Tools
I ran hands-on workshops for economists at UCSD on using Claude for Econ Research.
Claude Desktop Workshop for Economists (April 2026)
Using AI tools in economics research: writing and editing Stata, R, and Python, integrating results into Overleaf, and keeping projects and replications organized, with live examples.
Workshop slides (PDF) · workshop thread on X
Permission Modes and Auto: A Short Follow-Up (July 2026)
The difference between Manual and Auto mode, and why version controlling with git and/or Dropbox does more of the safety work than the permission prompt.
Short deck (PDF) · my global CLAUDE.md rules
Data
Datasets you may find useful to explore geo-spatial and/or mental-health-related research ideas.
Geospatial data for development & urban research
Publicly available spatial and satellite data for development and urban research:
| Topic | Dataset | Geographic units | Time coverage | Key variables | Spatial data | Access |
|---|---|---|---|---|---|---|
| Settlement & population | GHS - Global Human Settlement Layer (JRC / Copernicus) | Global grid (100 m - 1 km); GHS-UCDB city polygons | 1975 onward, in epochs | Built-up surface (GHS-BUILT), population (GHS-POP), settlement model / degree of urbanization (GHS-SMOD), consistently delineated cities (GHS-UCDB) | Rasters; UCDB as vector polygons | Free, open |
| Household surveys + GPS | DHS - Demographic and Health Surveys | Survey clusters, country | 1985 onward, repeated cross-sections | Health, fertility, and wealth microdata; geospatial covariates such as night lights | Randomly displaced GPS cluster coordinates | Free, registration; GPS needs a short access request |
| Economic activity proxy | Night lights - VIIRS & DMSP (Earth Observation Group) | Global grid (VIIRS ~500 m; DMSP ~1 km) | DMSP 1992-2013 (an extension series runs to 2019); VIIRS 2012 onward | Nighttime radiance, a standard proxy for local economic activity | Rasters | Free, but bulk downloads now need an EOG account; also on Google Earth Engine |
| Urban extent, from night lights | Annual urban extents - Zhao et al. (2022), paper | Global grid, ~1 km | 1992-2020, annual | Binary urban / non-urban maps built from harmonized night lights (DMSP-OLS through 2013, VIIRS-derived after). Note this is a core-urban-domain concept, not a Landsat impervious-surface product like GAIA, so the two are not drop-in substitutes | Rasters | Free, open (CC BY 4.0) |
| Gridded GDP | Kummu et al. - gridded GDP & HDI | Global grid, 5 arc-min (~10 km); the update also gives 30 arc-sec and admin-level polygons | 1990-2015, annual; the 2025 update runs 1990-2022 | GDP per capita PPP, total GDP, HDI. The 2025 update extends GDP per capita and downscales to admin-2, but drops HDI, so for gridded HDI you still need the 2018 release | NetCDF; update adds gpkg and CSV | Free, open (CC BY 4.0) |
| Gridded GDP | Local GDP estimates - Rossi-Hansberg & Zhang (2026), paper | Global cells at 1, 0.5, and 0.25 degrees | 2012-2022, annual | Predicted local GDP with uncertainty bounds, from a random forest on population, night lights, land use, emissions, and vegetation. Predictors reach beyond night lights, which helps if night lights are your regressor | Shapefiles + CSV | Public; no explicit license stated |
| Administrative boundaries | GADM | Country down to level 2-3 | Current, versioned releases | Administrative names and codes | Vector boundaries | Free for non-commercial use |
| Census microdata + boundaries | IPUMS International | Harmonized GEOLEV1 / GEOLEV2 (consistent over time) and unharmonized year-specific admin units | 1960 onward, census rounds | Census microdata linked to boundaries; IPUMS USA does the same for the US | GIS boundary files | Free, registration |
| India, villages and towns | SHRUG - Socioeconomic High-resolution Rural-Urban Geographic Platform (Development Data Lab) | Villages and towns (shrids), plus subdistrict, district, and assembly constituency | About 25 years, with units held to consistent boundaries since 1991 | Dozens of socioeconomic datasets linked on one set of identifiers, so different Indian sources merge cleanly; browsable in the SHRUG Atlas | Village and town polygons based on the 2011 Census | Free, open access; modules downloaded separately |
Working with night lights. Matt Lowe’s Night Lights and ArcGIS: A Brief Guide (2014) walks from the raw downloads to an analysis-ready dataset, covering clipping, gas-flare removal, and projections. The ArcGIS workflow still holds; its data links predate the move to the Earth Observation Group, so pair it with the VIIRS and DMSP links above. (Linked via the Internet Archive: the original MIT URL now 404s.)
Village and town data for India. SHRUG, the Socioeconomic High-resolution Rural-Urban Geographic Platform, is open data covering over 500,000 villages and 8,000 towns in India, from the Development Data Lab.
Aggregated catalogs. The UPenn Libraries GIS guide (global and US spatial data) and the geo4.dev data catalog (development-focused) list many more sources.
More spatial datasets to check (compiled by Gordon McCord)
GIS data sources for the social sciences, grouped by topic and then by country, from Gordon McCord’s list. Sources already in the geospatial table above (DHS, IPUMS, and the EOG night lights) are left out.
Multi-topic
- Free GIS Data - Robin Wilson’s catalog of free datasets, by topic and by country
- DIVA-GIS - country-level boundaries, roads, railways, elevation, land cover, and population density
- Natural Earth - free vector and raster base maps at 1:10m, 1:50m, and 1:110m scales
- Stanford EarthWorks - a searchable geospatial data repository
- HYDE - History Database of the Global Environment: gridded population and land use over the last 12,000 years
- G-Econ - Yale’s gridded economic activity at 1-degree cells, for several years
- Simulated VIIRS night lights - a consistent annual series from 1992 at about 500 m, built by simulating VIIRS-like values from DMSP images (Chen et al. 2024)
Demography and income
- WorldPop - high-resolution gridded population, global and by country
- Meta population density maps - population density estimated from buildings detected in satellite imagery; files on HDX
- CIESIN (Columbia) - gridded population, urban extents, and other socioeconomic data; its SEDAC collection is searchable in NASA Earthdata
Infrastructure
- OpenStreetMap - crowd-sourced street maps for the whole world
- gROADS - Global Roads Open Access Data Set, version 1 (1980-2010), from CIESIN
- Accessibility to Cities (Malaria Atlas Project) - travel time to the nearest city in 2015 at 1 km (Weiss et al. 2018), listed as “Travel time to cities” on that page
Agriculture
- EarthStat - global gridded crop areas and yields by crop, pasture, and fertilizer use
- SAGE (Wisconsin) - environment and agriculture datasets from the Center for Sustainability and the Global Environment
- GRACE (NASA) - monthly changes in water storage, groundwater included, from satellite gravity measurements
- Gridded yield changes under 1-3°C of warming - maize, rice, soy, and wheat (Moore et al.)
- Land Matrix - a public database of large-scale land deals
- FAO AgroMaps - subnational agricultural production and yields over time, shared through McCord’s Dropbox
Health
- Malaria Ecology Index - the stability of malaria transmission implied by local temperature, rainfall, and the dominant mosquito vector (Kiszewski et al. 2004), extended and validated against serological data in McCord and Anttila-Hughes (2017)
Conflict
- PRIO (Peace Research Institute Oslo) - conflict datasets, including Conflict Site (georeferenced armed conflicts, 1989-2008) and PRIO-GRID (a global grid with conflict, socioeconomic, and environmental variables)
Weather and climate
- University of Delaware temperature and precipitation - monthly gridded land data at 0.5 degrees, hosted by NOAA
- TerraClimate - monthly high-resolution temperature, precipitation, and water-balance variables, 1958 onward
Other environmental data
- Global Solar Atlas - solar energy potential
- Global Wind Atlas - wind energy potential
Hazards
- Natural Disaster Hotspots (Columbia) - global mortality and economic-loss risk from earthquakes, volcanoes, landslides, floods, drought, and cyclones (data)
- Dartmouth Flood Observatory archive - large flood events worldwide, 1985-2010, on HDX
Urban areas
- Atlas of Urban Expansion (NYU, UN-Habitat, and the Lincoln Institute) - urban extent of a global sample of 200 cities, 1990-2015, with growth back to the 19th century for some cities
China
- China Data Online - Chinese statistics from yearbooks and censuses (subscription)
- Free Chinese GIS data - an Apollo Mapping guide centered on the China Historical GIS
- China in Time and Space (CITAS) - an archived University of Washington collection of Chinese spatial data
- AidData’s Chinese development finance data - China’s development finance abroad, project by project
Japan
- e-Stat GIS - Japan’s official statistics portal, with boundary files and small-area data
- University of Michigan guide to Japan GIS data - datasets and GIS files, including boundaries from the Tokugawa (Edo) and Meiji periods
- Healthcare professionals in Japan - Ministry of Health, Labour and Welfare tables (PDF, in Japanese)
Mexico
- CONABIO geoportal - downloadable biodiversity GIS data
- INEGI - Mexico’s statistics office, with municipal-level data to merge onto municipal boundaries
United States
- GeoPlatform.gov - the federal government’s geospatial data portal
- TIGER/Line shapefiles - Census boundaries from states down to blocks, plus roads
- data.census.gov - Census Bureau tables, the successor to American FactFinder
- LEHD - Census Bureau employer-household data, including commuting flows
- Dartmouth Atlas of Health Care - health-care resources and use by ZIP code and primary care service area
- School locations (NCES EDGE) - geocoded public and private schools
- MarineCadastre.gov - ocean data for US waters, including vessel traffic
- NOAA sea level rise data - sea level rise inundation data for the US coast
- CDC Social Vulnerability Index - vulnerability by census tract and county
- Social Deprivation Index (Robert Graham Center) - down to ZIP code and census tract
- USGS National Map downloader - elevation, hydrography, land cover, and other base layers
- NASA smoke, dust, and ash data - near real-time satellite products for tracking smoke plumes
- USA Cropland (Esri, from the USDA Cropland Data Layer) - crop type at 30 m, annually since 2008
US state and local
- LA County Open Data
- California Open Data
- California State Geoportal
- NYC Open Data
- Florida Geographic Data Library
- US City Open Data Census - which US cities publish which open datasets
San Diego region
Sub-Saharan Africa
- Sub-Saharan public hospitals - a geocoded database of public hospitals (Harvard Dataverse)
- Georeferenced Afrobarometer (AidData) - geocoded survey responses from 37 African countries on citizens’ priorities, local and national institutions, public services, and corruption
Mental health data
Publicly available datasets with a validated mental-health or wellbeing measure, plus a few open-replication economics papers and speech/audio depression corpora; free with registration unless a restricted/paid flag is noted. Sleep has its own section below, though the survey tables here also note what sleep each dataset collects.
Development and low- or middle-income country panels
| Dataset | MH / sleep measures | Geographic coverage | Level | Total N | Youth available? | Access |
|---|---|---|---|---|---|---|
| IFLS - Indonesia Family Life Survey | CES-D-10 Sleep: PROMIS quality & disturbance items (wave 5) | Indonesia, 13 provinces; province-level (GPS restricted) | Individual & household | ~30,000 individuals / 7,200+ households | Yes, age 15+ | Free, registration |
| MxFLS - Mexican Family Life Survey | Zung/Calderon depression Sleep: daily hours (time-use, all waves) | Mexico, national; state & municipality | Individual & household | ~35,000 individuals / 8,400 households | Yes, age 15+ | Free, registration |
| Young Lives | SRQ-20, GAD-7/PHQ-8, Cantril Sleep: time-use hours/day (rounds 2-5, 7) | Ethiopia, India, Peru, Vietnam; region/district | Individual (child cohort) | ~12,000 children | Youth cohort (child to young adult) | Free, registration (UK Data Service) |
| NIDS - National Income Dynamics Study | CES-D-10 Sleep: only the CES-D restless-sleep item | South Africa, national; district municipality | Individual | ~28,000 individuals / 7,300 households | Yes, age 15+ | Free, registration |
| CFPS - China Family Panel Studies | CES-D, Kessler K6 Sleep: hours (2014+), bedtime & naps (all waves) | China, 25 provinces (~95% of pop.) | Individual & household | ~42,600 individuals / 14,960 households | Yes, age 10+ | Free, registration + data-use agreement |
| KLPS - Kenya Life Panel Survey | CES-D-10 (KLPS-4) Sleep: bed/wake times, quality, naps (KLPS-4) | Kenya, Busia County cohort (followed nationwide and abroad) | Individual (+ 2nd-gen children) | ~7,500 cohort + ~5,200 children | Yes (young-adult cohort) | Free, open (CC0) |
| DHS - Demographic and Health Surveys | Mental Health module (optional, introduced with DHS-8 in 2022): full PHQ-9 + GAD-7 Released: Nepal 2022, Bangladesh 2022, Mozambique 2022-23, Zimbabwe 2023-24, Zambia 2024. Lesotho 2023-24 fielded PHQ-9 only, no GAD-7. Timor-Leste 2025-26 is fielded but not fully released; Sierra Leone 2026 is planned. Senegal 2023 is tagged “mental health” but uses a different, locally developed instrument, not PHQ-9/GAD-7 Sleep: none | The module is only in the surveys listed, not in most DHS; 63 countries overall, with randomly displaced GPS clusters | Individual & household | ~5,000-30,000 households / survey | Yes, 15-49 (Bangladesh: ever-married women only; Nepal and Lesotho: a subsample) | Free, registration |
United States, UK & Europe
| Dataset | MH / sleep measures | Geographic coverage | Level | Total N | Youth available? | Access |
|---|---|---|---|---|---|---|
| Add Health | CES-D (modified) Sleep: duration, timing & quality items (all waves) | US, national; geocodes restricted | Individual | ~20,000 (in-home) | Yes (adolescent cohort) | Public-use free; full sample restricted |
| NSDUH - Nat. Survey on Drug Use & Health | Kessler K6, MDE module Sleep: MDE insomnia / hypersomnia items only | US, national + state (small-area est.) | Individual | ~67,500 / year | Yes, age 12+ | Free public-use files |
| NHANES | PHQ-9 Sleep: SLQ items (2005+); wrist accelerometry 2011-14 | US, national only in public file | Individual | ~5,000 / year | Yes (12-17 restricted) | Free (18+); 12-17 file restricted |
| NCS-R / NCS-A | CIDI diagnostic Sleep: insomnia items; NCS-A adds bedtime & hours | US, national | Individual | 9,282 / 10,123 | Yes (NCS-A, 13-18) | NCS-R free; NCS-A restricted |
| HRS - Health & Retirement Study | CES-D-8 Sleep: Jenkins insomnia items (2002+); time-use hours | US, national | Individual | ~20,000 / wave | No (50+) | Free, registration |
| Healthy Minds Study | PHQ-9, GAD-7, flourishing Sleep: duration items; ISI module (some waves) | US colleges; Census region only, individual colleges blinded | Individual (student) | ~935,000 (675+ colleges) | Students only (college) | Free, de-identified; short data-request form |
| Understanding Society (UKHLS) | GHQ-12, SWEMWBS; youth SDQ Sleep: PSQI-derived items (waves 1, 4, 7, 10, 13) | UK; region public, finer restricted | Individual & household | ~40,000 households / ~100,000 individuals | Yes (youth panel 10-15) | Free, registration (UK Data Service) |
| ELSA - English Longitudinal Study of Ageing | CES-D-8 Sleep: items in waves 4/6/8; wrist actigraphy (wave 10) | England; region-level public | Individual | ~11,400 (Wave 1 core) | No (50+) | Free, registration |
| SHARE | EURO-D Sleep: trouble-sleeping & medication items; hours (waves 8-9) | 28 European countries + Israel; country-level | Individual | ~160,000 respondents | No (50+) | Free (scientific use), registration |
| UK Biobank | PHQ-9, GAD-7, CIDI-SF Sleep: duration, chronotype & insomnia items; actigraphy (~103,000) | UK; location restricted (1 km grid) | Individual | ~500,000 | No (40-69) | Application + fee + agreement |
Cross-national and global
| Dataset | MH / sleep measures | Geographic coverage | Level | Total N | Youth available? | Access |
|---|---|---|---|---|---|---|
| WHO World Mental Health | CIDI diagnostic Sleep: insomnia items (chronic-conditions section) | 28+ countries; country-level | Individual | >200,000 interviews | No (adults) | Restricted (consortium agreement) |
| HBSC - Health Behaviour in School-aged Children | Psychosomatic scale, Cantril Sleep: sleep-onset difficulties (all rounds); bedtimes (optional) | 45+ countries; country/region | Individual (student) | ~220,000+ / round | Students only (ages 11/13/15) | Aggregate public; microdata by request (embargo) |
| Global Burden of Disease | Modeled prevalence & burden (not survey items) Sleep: none | 204 countries + some subnational | Country-year (aggregate) | Aggregate (not respondents) | Yes (age bands, incl. 10-19) | Free, registration |
Subjective wellbeing (life satisfaction and happiness, not clinical mental health)
| Dataset | MH / sleep measures | Geographic coverage | Level | Total N | Youth available? | Access |
|---|---|---|---|---|---|---|
| Gallup World Poll | Cantril ladder, daily affect Sleep: “well-rested yesterday” item only | 160+ countries; country-level | Individual | ~1,000 / country / year | Yes, age 15+ | Paid microdata; some free aggregates |
| World Values Survey | Life satisfaction, happiness Sleep: none | 64 countries (Wave 7); country-level | Individual | ~95,000 / wave | No (18+) | Free, registration |
Columns in the four tables above: MH / sleep measures = each dataset's mental-health instruments and any sleep data it collects (from the questionnaires / codebooks). Youth available? = whether adolescents / young adults are covered (by age in a filterable general sample, by student status, or as a youth-only sample).
Key mental-health economics papers (with public replication data)
| Paper | Year | Journal | Population | Intervention | Replication | Mental-health variables |
|---|---|---|---|---|---|---|
| Haushofer & Shapiro | 2016 | QJE | Poor households, Kenya | RCT: unconditional cash transfers | Harvard Dataverse | Psychological-wellbeing index: CES-D, Cohen stress, WVS happiness & life satisfaction, salivary cortisol |
| Baranov, Bhalotra, Biroli & Maselko | 2020 | AER | Perinatal mothers, rural Pakistan | RCT: perinatal CBT (Thinking Healthy) | openICPSR | SCID (major-depression diagnosis), Hamilton scale, disability, GAF, social support |
| Bessone, Rao, Schilbach, Schofield & Toma | 2021 | QJE | Low-income adults, Chennai (India) | RCT: night-sleep devices / incentives; workplace naps | Harvard Dataverse | Psychological-wellbeing index: depression, stress, happiness, life satisfaction, Cantril ladder |
| Banerjee, Duflo, McKelway, Schilbach et al. | 2023 | Ann. Intern. Med. | Elderly living alone, Tamil Nadu (India) | RCT: phone-based CBT; one-time cash transfer | Harvard Dataverse | Geriatric Depression Scale, WHODAS, single-item loneliness |
| Angelucci & Bennett | 2024 | AER | Adults with depression, Karnataka (India) | RCT: antidepressant pharmacotherapy; livelihood support | openICPSR | PHQ-9 (screening + severity) |
Detecting depression from speech / audio - public corpora, mostly from the speech-ML and clinical communities (I found no economics study that has released audio-based depression data):
- DAIC-WOZ / E-DAIC (USC). Field-standard English corpus: clinical interviews, audio + transcripts, PHQ-8 labels (the AVEC benchmark). Free but restricted (signed application, institutional email).
- Androids Corpus. Italian speech (reading + interview), clinician diagnoses; open direct download (academic terms).
- EATD-Corpus. Chinese speech + text with SDS depression labels; open download.
- MODMA (Lanzhou). Audio (+ EEG), clinical MDD diagnosis; free but account + agreement.
Sleep data
Sleep measured objectively (actigraphy, wearables, polysomnography) alongside self-report, plus the economics field experiments that have collected it. For sleep items inside the large mental-health panels (IFLS, MxFLS, Add Health, HRS, Understanding Society, and others), see the survey tables in the mental health section above.
Sleep in economics field experiments - objective wearable/actigraphy sleep alongside self-report and economic outcomes:
| Study | Year | Population | Sleep measure | Data |
|---|---|---|---|---|
| Bessone, Rao, Schilbach, Schofield & Toma, QJE | 2021 | Low-income adults, Chennai (India) | Actigraphy + self-report | Harvard Dataverse (public) |
| Giuntella, Saccardo & Sadoff, JPE (forthcoming) | 2025 | ~1,150 US university students | Fitbit + self-report | NBER w32550; replication not yet public |
| Avery, Giuntella & Jiao, REStat | 2025 | US college students | Wearable + self-report | paper; no public package located |
Objective sleep-data repositories (polysomnography and actigraphy):
| Source | Sleep measure | Coverage | Access |
|---|---|---|---|
| NSRR - National Sleep Research Resource (NHLBI) | PSG + actigraphy + questionnaires | 13+ cohorts, 26,000+ people (SHHS, MESA, MrOS, CHAT, …) | Free, per-dataset data-use agreement |
| UK Biobank accelerometer sub-study | Wrist actigraphy (7-day); derived sleep duration/efficiency/timing | ~104,000 participants | Approved application + fee |
| NHANES accelerometry (2011-2014) | Wrist accelerometry (minute-level) | US, nationally representative | Fully public, no application |
| PhysioNet (Sleep-EDF, MMASH, Apple-Watch+PSG) | PSG and/or consumer wearable with PSG labels | Small validation cohorts | Mostly open access |
Research Tools
These are original tools and guides, built by me and by students in my lab.
An interactive map of 19 free-movement and visa-free work regimes involving lower- and middle-income countries.
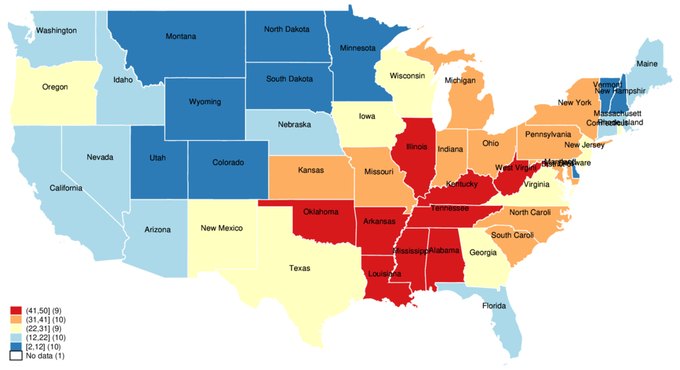
Useful Stata tools with self-help guides, including making maps (SPMAP / GRMAP) and sample do-files.
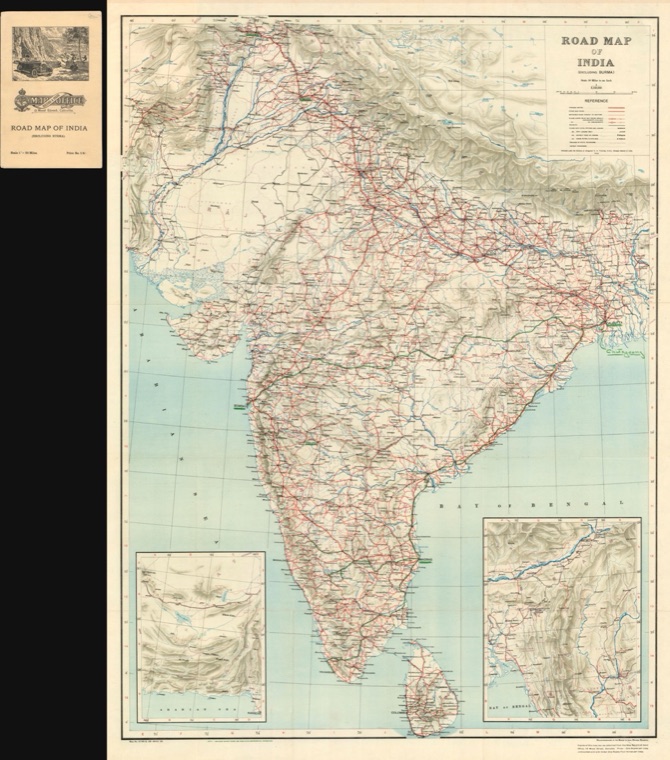
Digitizing historical maps with QGIS and Python
A step-by-step guide to georeferencing and digitizing historical maps (co-authored with a lab student).